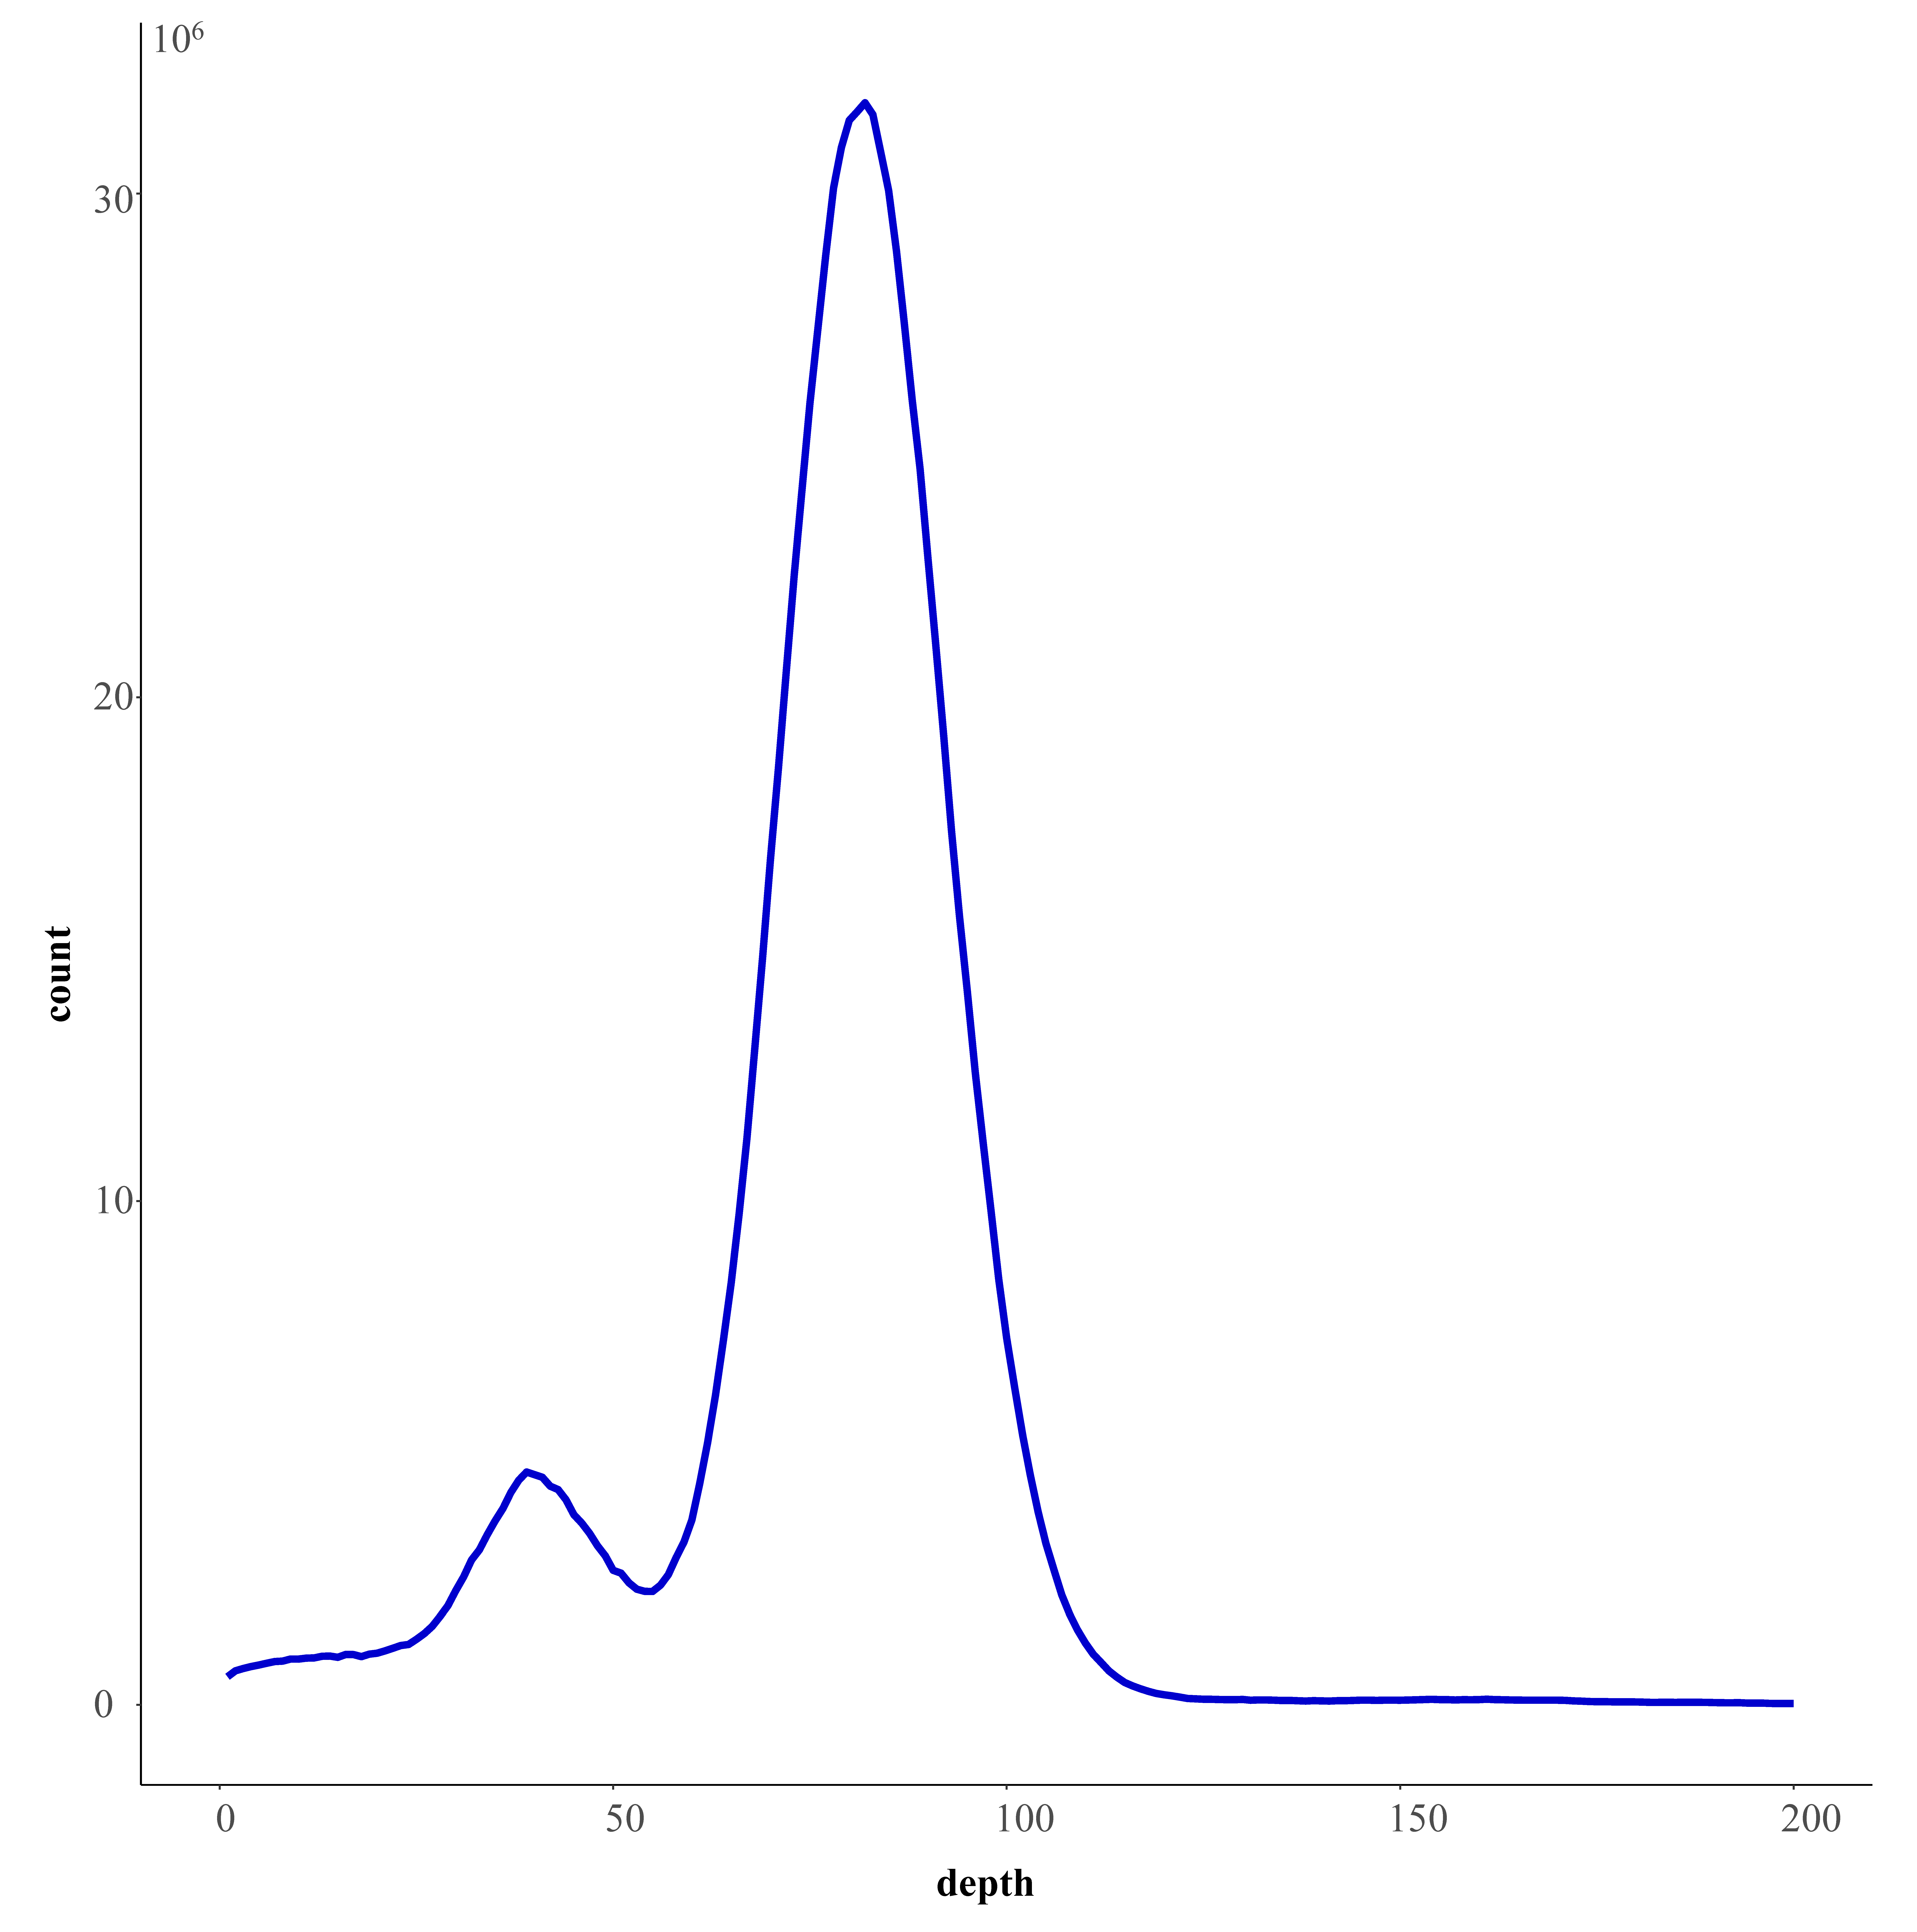
上一次说完绘制堆积柱状图之后,由于课题需要绘制geom_line图,也就是线图,
秉着公正公开的原则,就写一个短文来记录一下这个过程
开搞
在一个线图中,观察值都按照x排列并连接起来。
可以使用函数geom_line()、geom_step()或geom_path()。
图得类型大概如下:

数据
我们这里使用的数据来就是来自于个人课题的数据
数据格式举例如下:
1 | name depth count |
绘图
1 | getwd() |
结果

更多的内容就交给ggplot2的贵的了
缺失模块。
1、请确保node版本大于6.2
2、在博客根目录(注意不是yilia根目录)执行以下命令:
npm i hexo-generator-json-content --save
3、在根目录_config.yml里添加配置:
  jsonContent:
    meta: false
    pages: false
    posts:
      title: true
      date: true
      path: true
      text: false
      raw: false
      content: false
      slug: false
      updated: false
      comments: false
      link: false
      permalink: false
      excerpt: false
      categories: false
      tags: true